Overview
View valuable Physician and Advanced Practice Provider supply and demand data by specialty across all client specialties and geographic markets and gain a deeper understanding of competitive dynamics to inform growth and recruitment decisions.
Customizable to Your Health System’s Needs in HSG Dashboard
Workbook Features
Bring your data to life through different reporting lenses in HSG Dashboard.
- Provider Supply and Demand by Specialty and by Client Geography
- Service Area P/S/T, County, Zip Code, or other as defined by Organization
- FTE Demand by Specialty
- Physician Supply by Specialty
- Net Need by Specialty
- APP Supply
- Net Provider Need including APPs
- Provider Age and Succession Planning
- Over 65 by Specialty
- Over 65 by Geography
- Age Analysis Dashboard
- Medical Staff Aging Detail
- Reporting breakdowns are as follows:
CUSTOMIZABLE TO YOUR HEALTH SYSTEM’S NEEDS
HSG Dashboard Workbooks
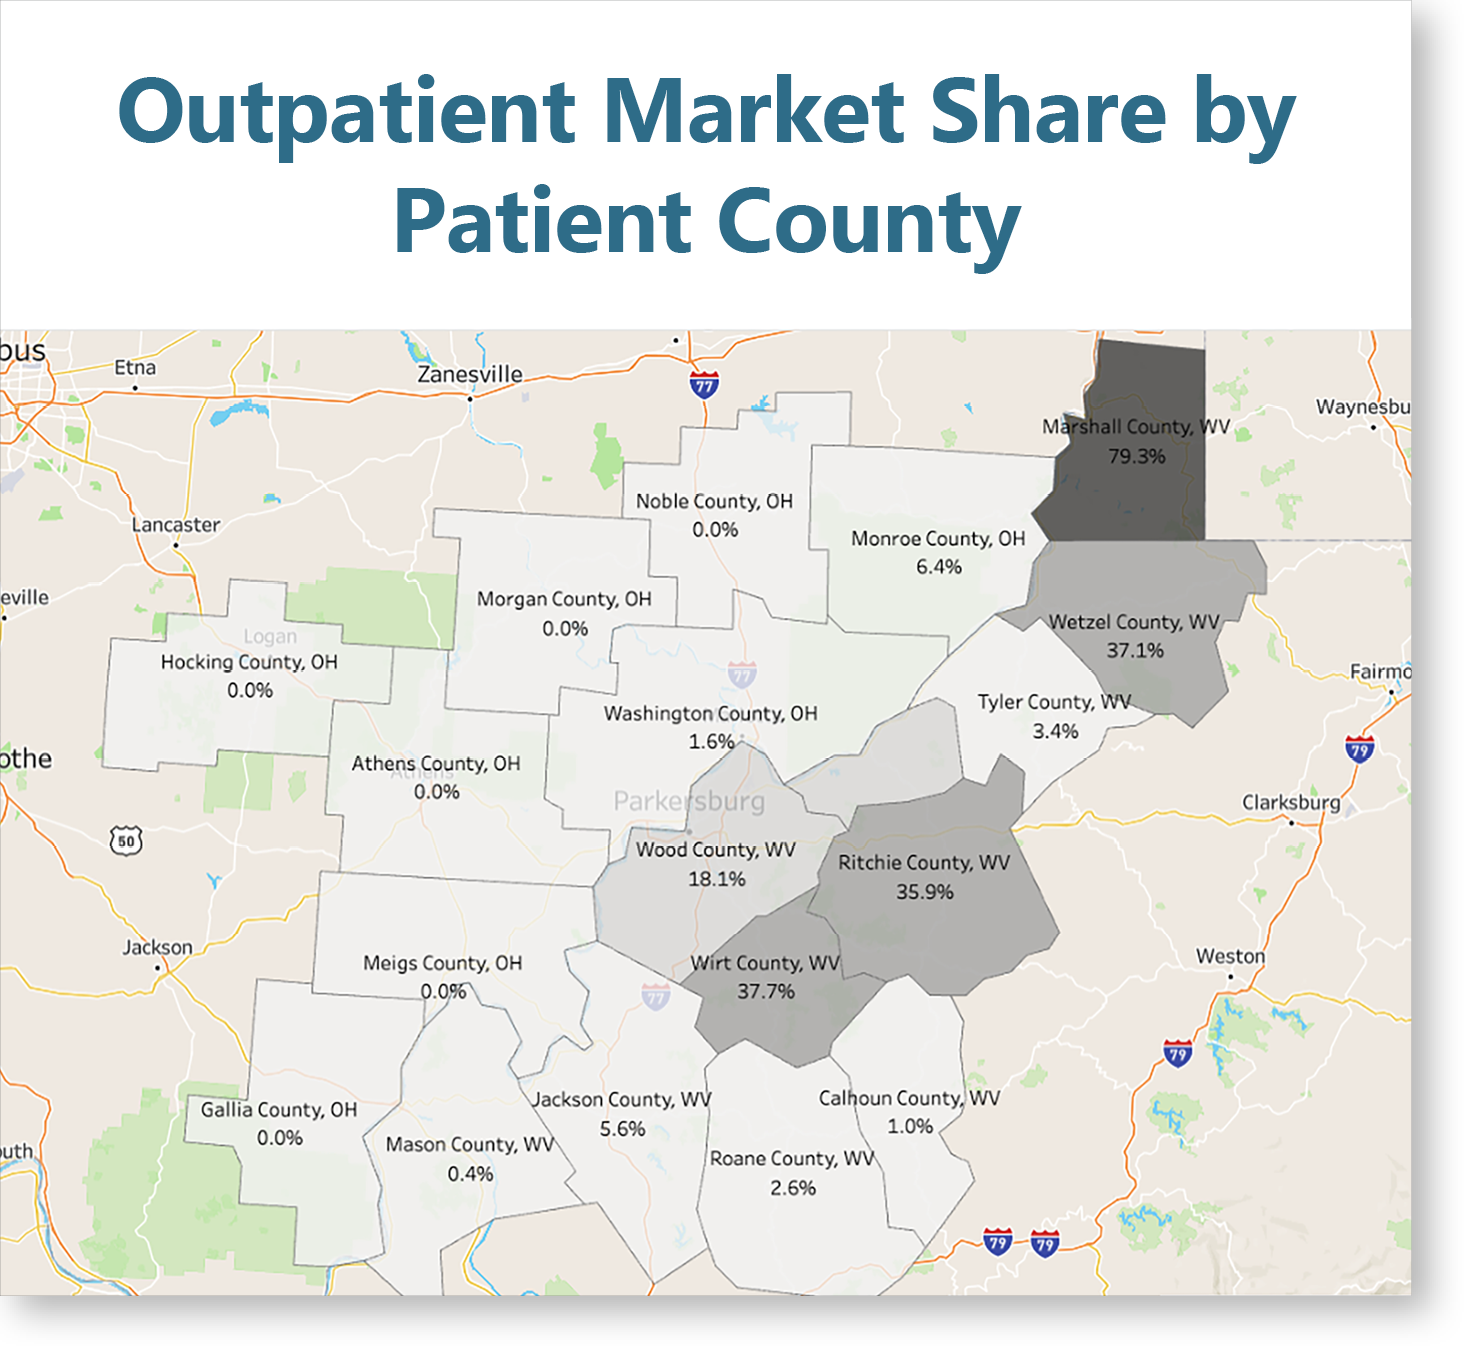
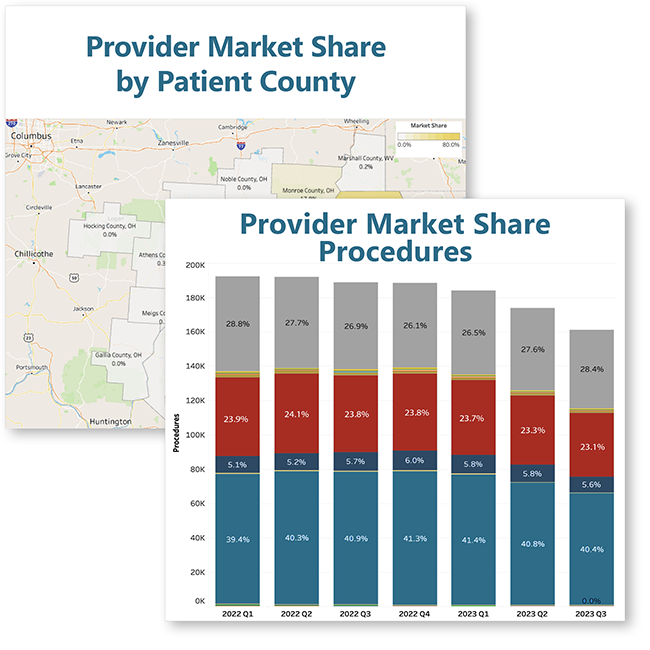
HSG Outpatient Service Line Market Share™
HSG Outpatient provider Market Share™
HSG State-level market Share™
HSG patient flow™
HSG Patient Share of Care™
HSG Market Demographics™
Related Resources
-
Understanding the Difference Between Data Governance and Analytics
Balancing data for smarter business decisions.
-
Understanding Your Competitive Market Share
Tools for Measuring Patient Acquisition and Market Competition
-
Understanding Your Primary Care Market Share
Optimize Primary Care for Growth and Patient Retention