Establish Patient Loyalty and Grow Revenue
Overview
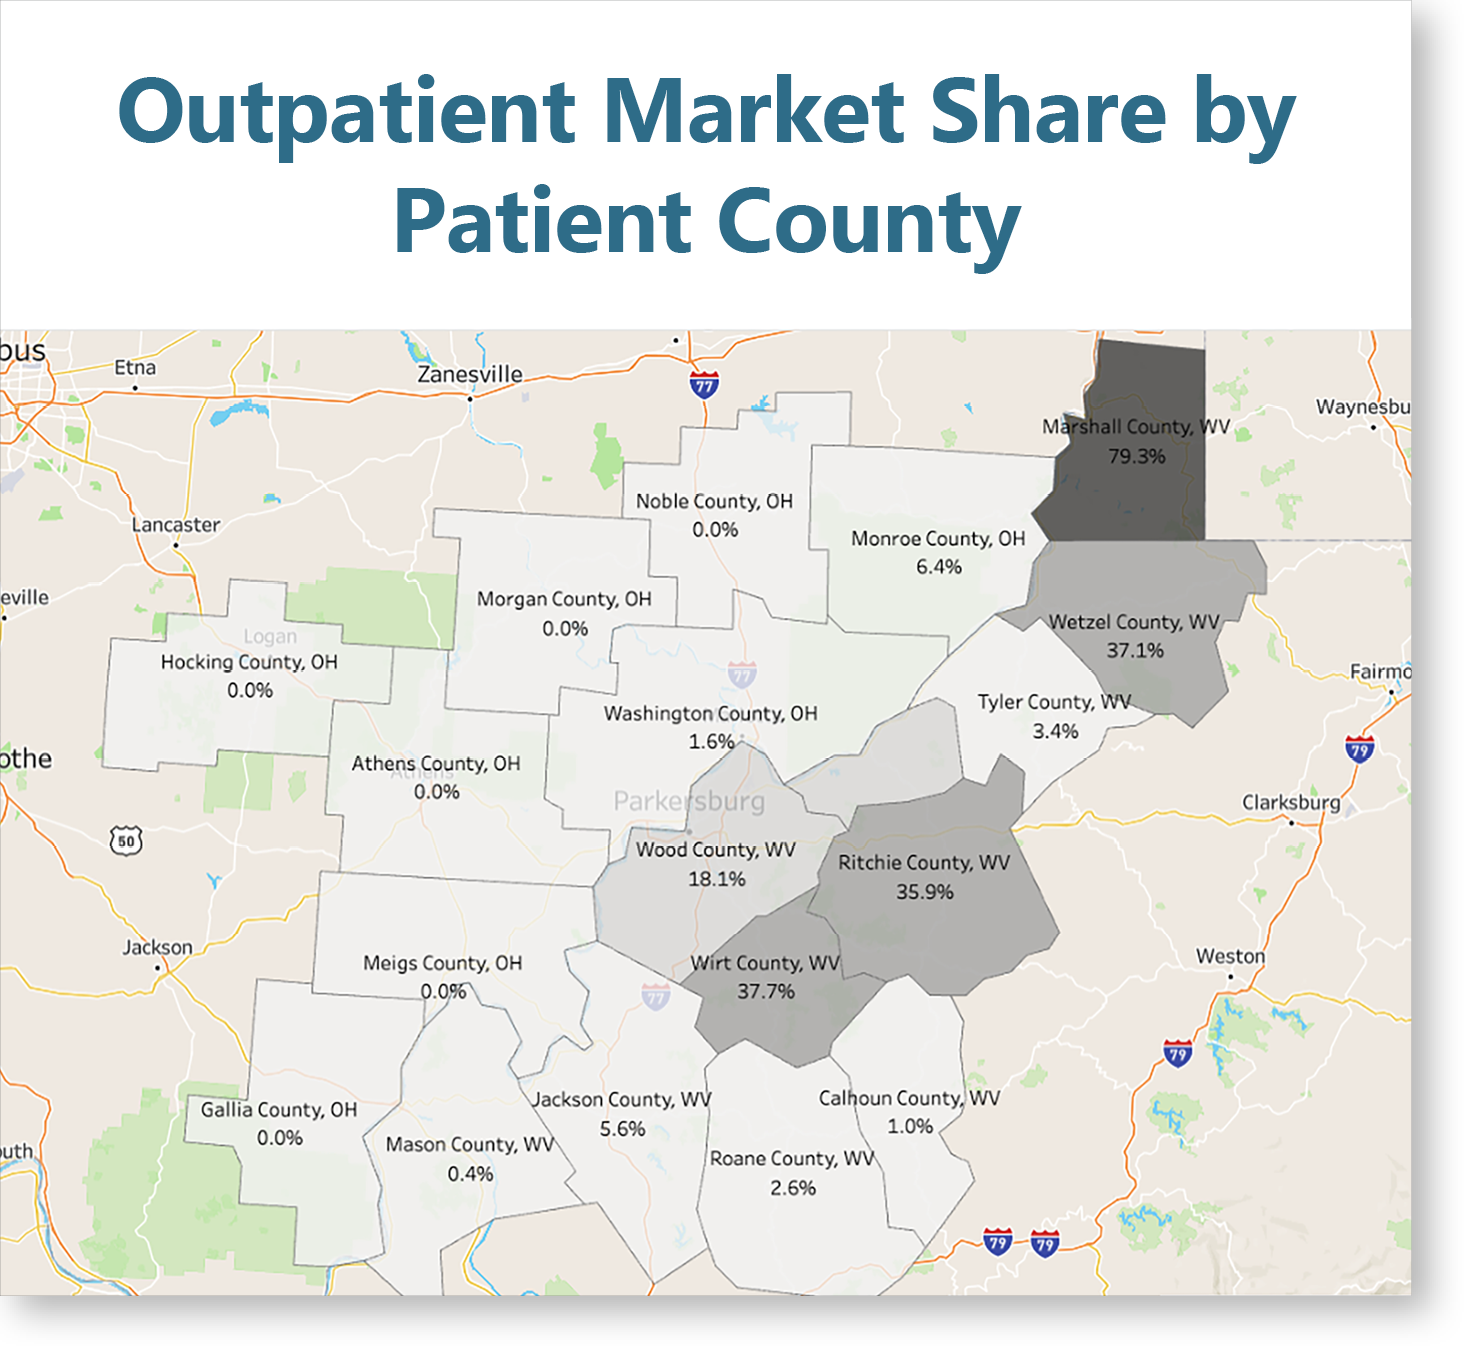
Identify areas of financial improvement by tracking overall patient utilization of the care continuum within a given market. Generate population-based reports that measure total patient healthcare spend (inpatient, outpatient, ambulatory, physician office, and more).
Identify Specific Network Needs in 3 Steps
Measuring Patient Share of Care
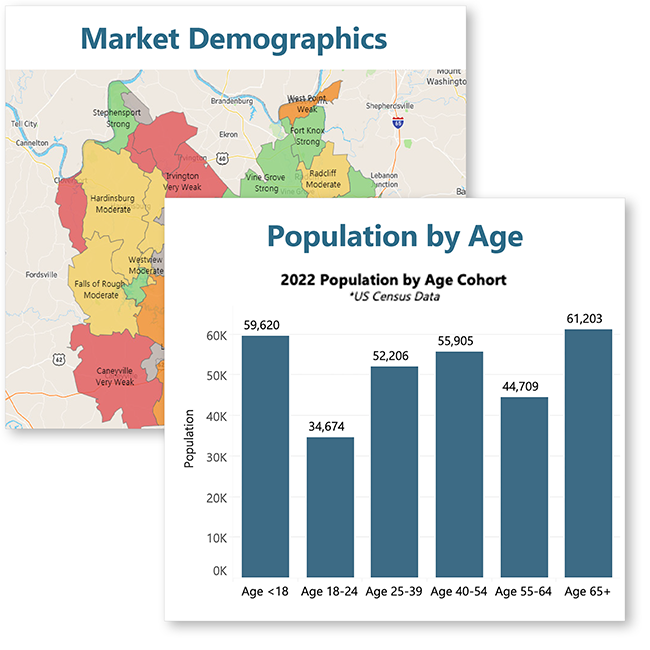
IDENTIFY PATIENT POPULATION
Provider Level
- Individual Provider(s)
- Practice(s)- Employed or
- Independent
- Group(s)- ACOs and CINs
- Competitor(s)
Facility Level
- Health Systems’ Hospitals
- ASCs
- Emergency Department
Apply (Non-Identifying)
Unique Patient Tracker
IDENTIFY “YOU”
What NPIs are “In Network?”
- Hospitals
- Ambulatory
- Ancillary
- Providers
What is “Out of Network?”
- Competitor Facilities
- Independent Practices
Not Working with Hospitals
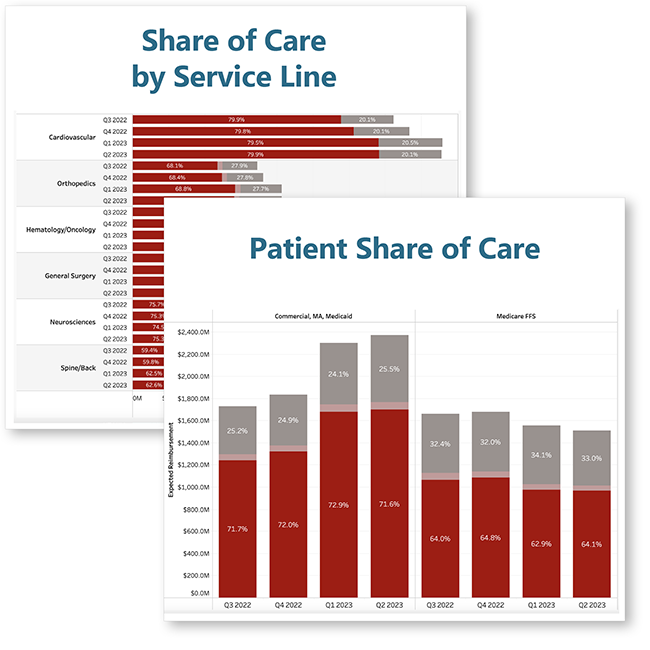
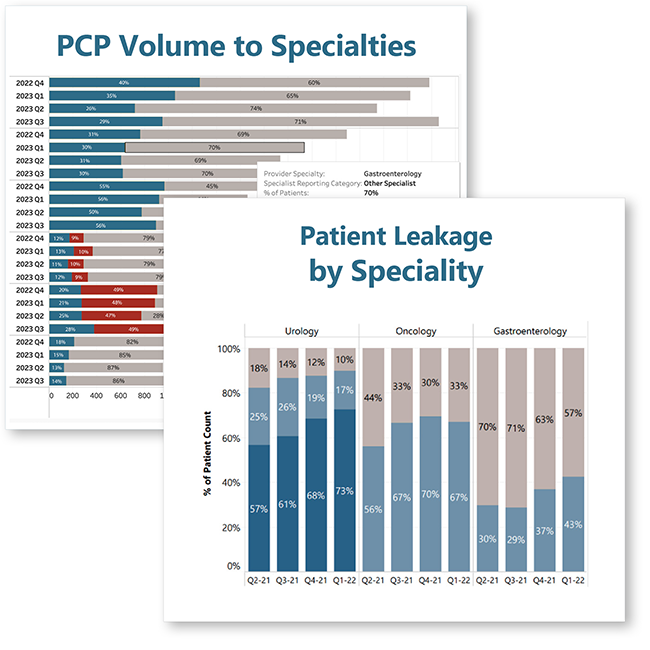
MEASURE PATIENT SHARE OF CARE
- Evaluate Site of Healthcare Service Rendering Providers
- Measure Service Volume “In Network” versus “Out of Network” by Facility, Service Line, Provider and Procedure
Examples:
- 53% of our PCP patient population seeks orthopedic care at ASCs in the market
- 90% of our ED patients receive cardiology procedures at competitor facilities
Customizable to Your Health System’s Needs
Workbook Features
Bring your data to life through different reporting lenses in HSG Dashboard.
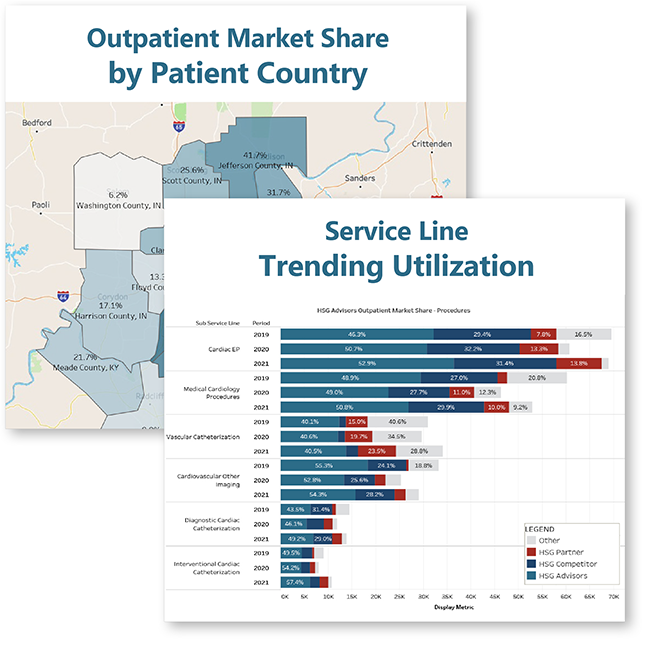
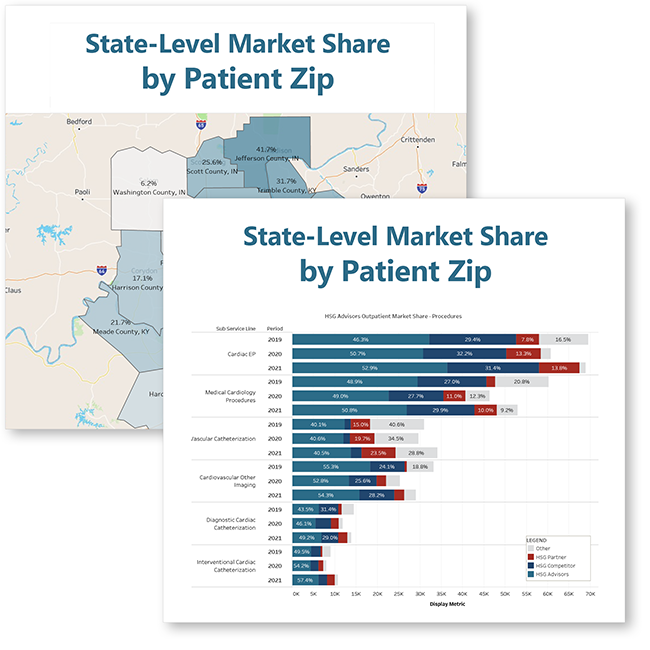
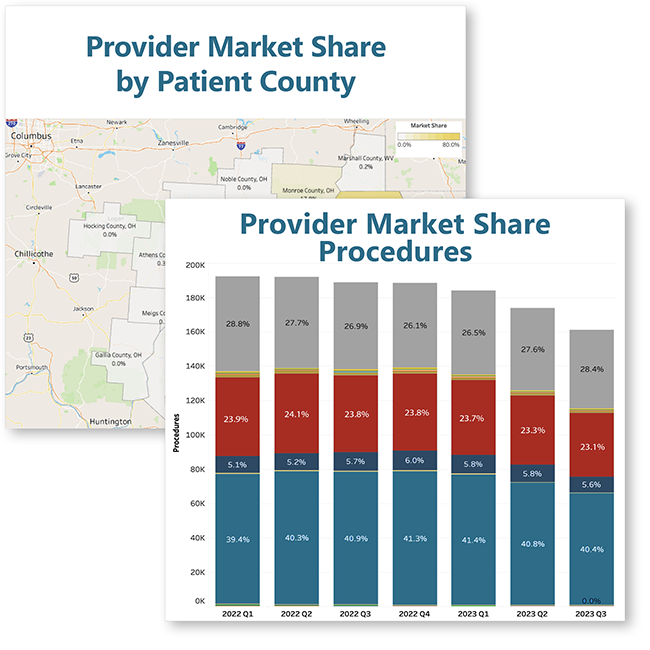
- Organization share by priority service lines, by PCP zip code
- Organization share for all service lines
- Organization share trended on rolling 12-month intervals
- Top 10 locations by service line
- Organization share by sub service line, by PCP zip
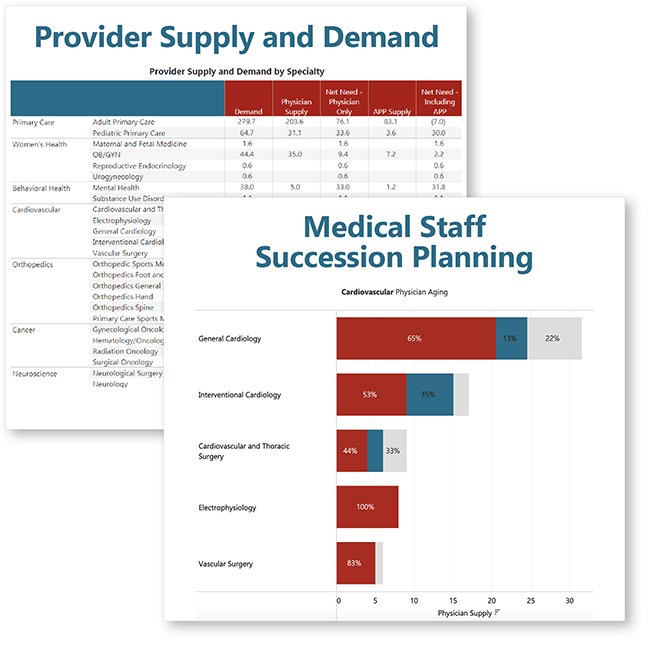
- Priority service line breakdowns for key service lines, such as:
- Cardiovascular
- General Surgery
- Neurosciences
- Orthopedics
- Oncology
CUSTOMIZABLE TO YOUR HEALTH SYSTEM’S NEEDS
HSG Dashboard Workbooks
Related Resources
-
Understanding the Difference Between Data Governance and Analytics
Balancing data for smarter business decisions.
-
Understanding Your Competitive Market Share
Tools for Measuring Patient Acquisition and Market Competition
-
Understanding Your Primary Care Market Share
Optimize Primary Care for Growth and Patient Retention