Grow Service Lines and Reduce Patient Leakage
Overview
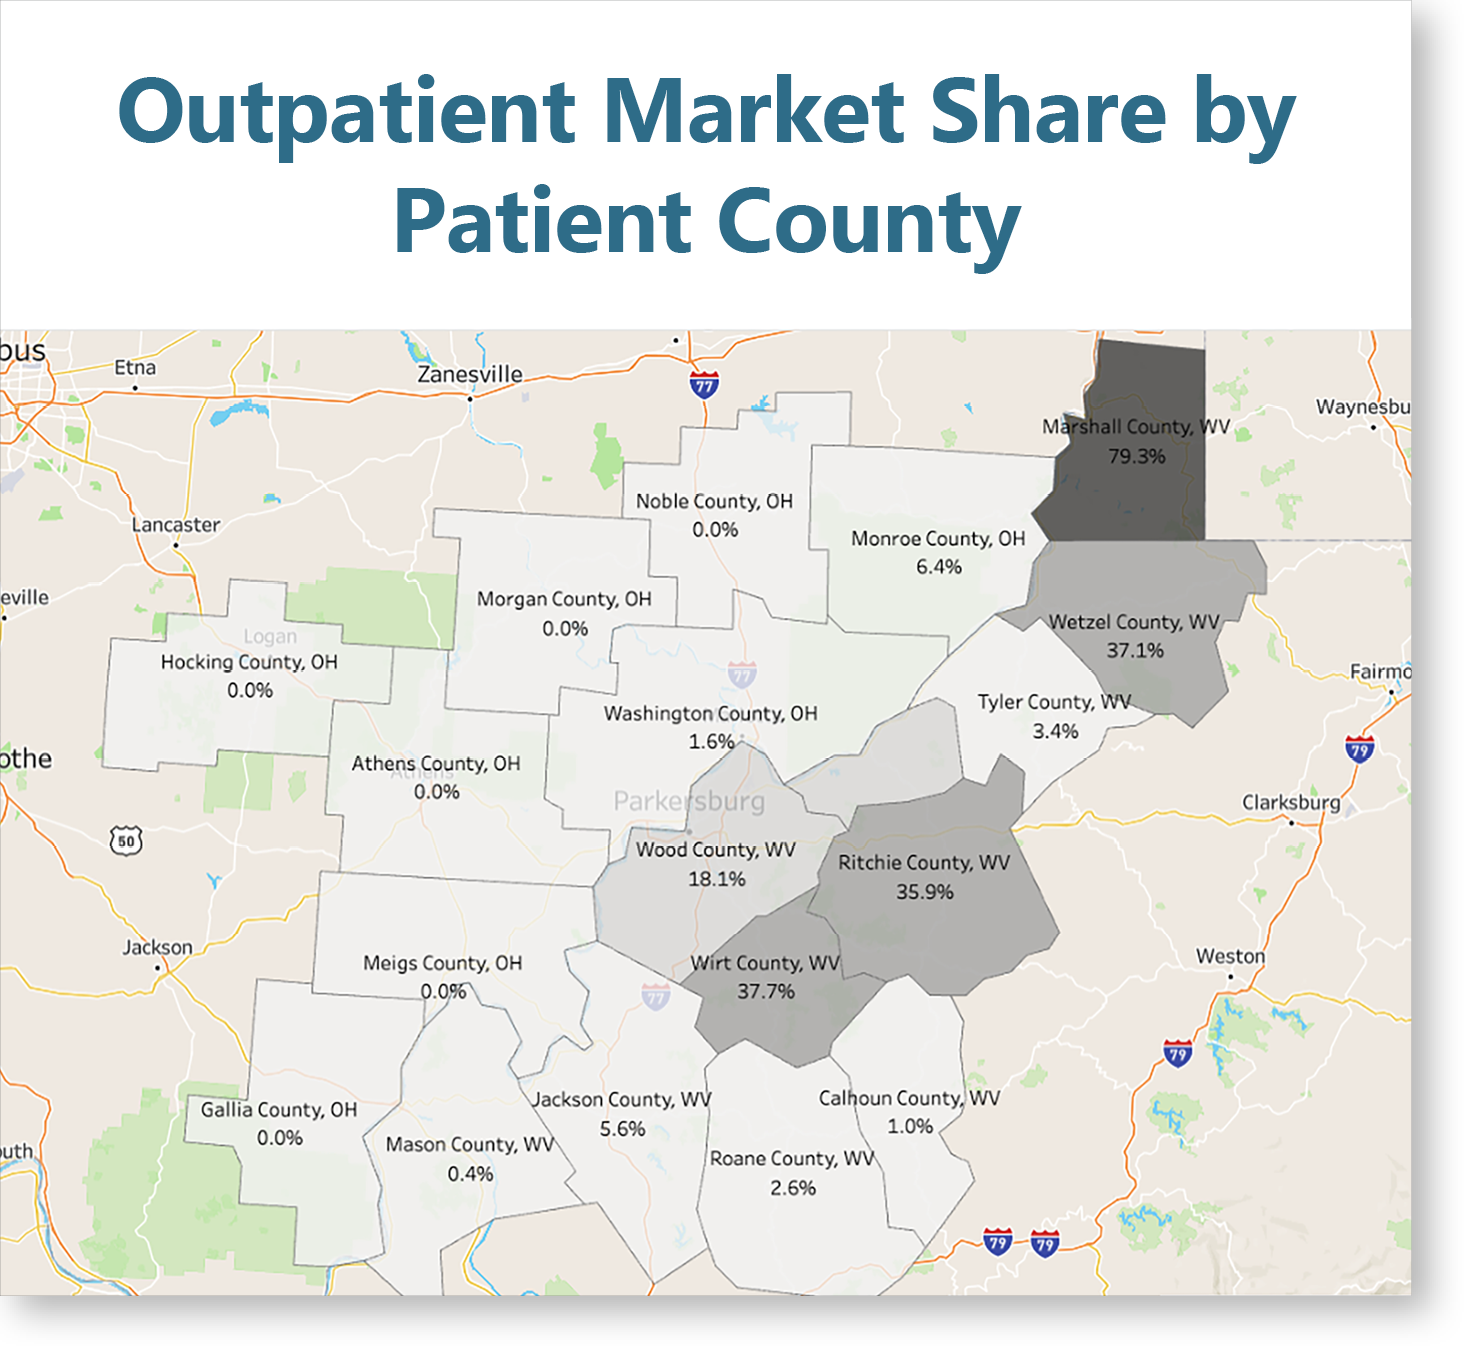
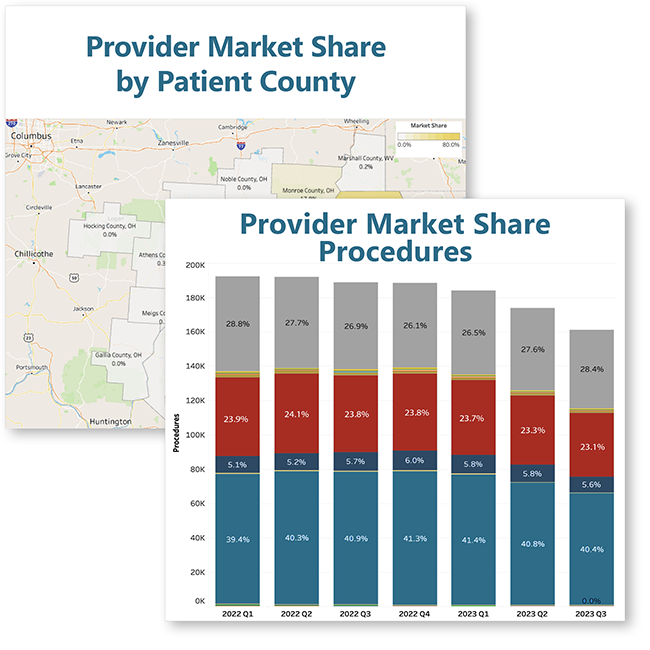
Evaluate your health system’s overall Physician and Advanced Practice Provider market share by specialty group, specialist, and subspecialist share by geographic region for professional services rendered by relative providers—a key metric in all reporting.
Customizable to Your Health System’s Needs in HSG Dashboard
Workbook Features
Bring your data to life through different reporting lenses in HSG Dashboard.
- Overall Provider Market Share (based on number of patients & procedures)
- Baseline reporting can be dated back to prior years and/or the historic timeline requested
- Overall Provider Share and Trending for All Specialty Groups, Specialists, and Sub-Specialists
- Provider Specialty Market Share
- Reporting breakdowns are as follows:
- Overall Share by Specialty and Sub-Specialty
- Specialty Share by County
- Top 10 & 20 Specialists and Providers
- Top 10 New vs. Established Patient Visits by Provider
- Location/Billing Entity Site of Service Breakdown by Provider
- Full-Detail Dashboards based on Rendering Specialist
- Providers’ Services to Patients in Service Area
CUSTOMIZABLE TO YOUR HEALTH SYSTEM’S NEEDS
HSG Dashboard Workbooks
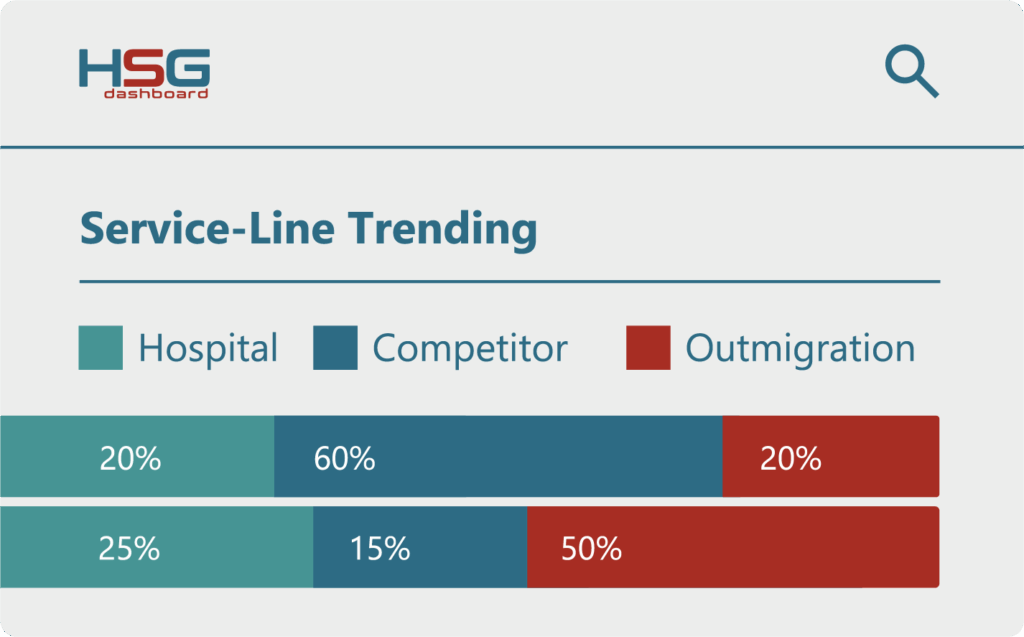
HSG Outpatient Service Line Market ShareTM
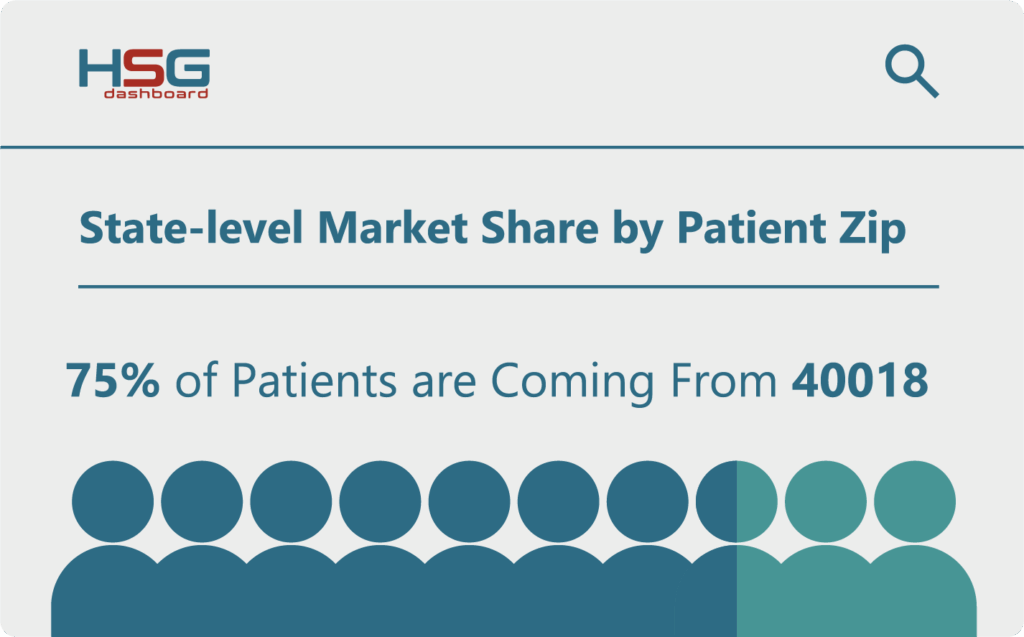
HSG State-Level Inpatient market shareTM
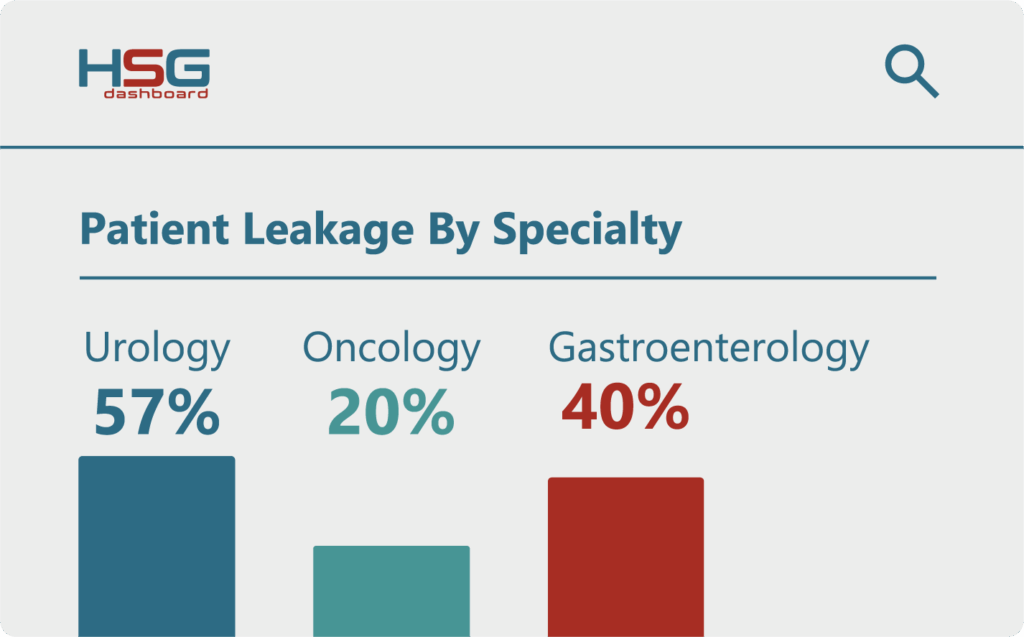
HSG patient flowTM

HSG Provider supply and demandTM
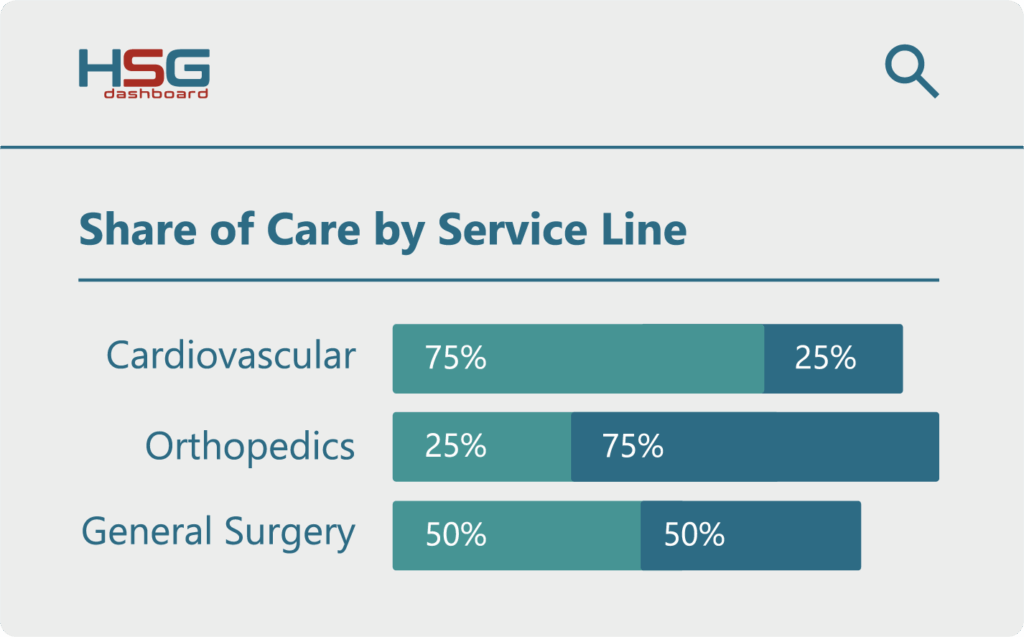
HSG patient share of careTM

HSG Market DemographicsTM
Related Resources
-
Understanding Your Competitive Market Share
Tools for Measuring Patient Acquisition and Market Competition


