Download the article as a PDF or read below:
A primary tenet of provider compensation plan design is to align plan incentives with organizational goals and objectives. With a consistent (though variable by market) payor contracting evolution headed toward value-based reimbursement, more and more employed provider networks are contemplating, initiating, or expanding the presence of nonproductivity incentives in their provider compensation model(s). Although degrees of productivity will always be crucial for financial sustainability, shifting emphasis to nonproductivity initiatives through compensation redesign can be highly fruitful.
Here are some things to consider in that process:
1. How commonly are nonproductivity incentives included in provider compensation models?
According to a national SullivanCotter survey report1, about half of respondents indicated that their provider compensation models contain “quality-based incentives.” Somewhat surprisingly, the primary care, medical specialties, surgical specialties and hospital-based were rather evenly represented in the reporting with percentages of 57%, 48%, 49%, 54% respectively. The actual percentages will vary by market based on the degree of value-based reimbursement penetration and by the size/complexity of the practice networks, based on their ability to support these initiatives.
2. What are some common nonproductivity incentives to consider?
Nonproductivity incentive metrics include just about any area of importance to an employed provider network or health system, other than volume/productivity metrics. Options include the following:
-
- Clinical Quality. Metric options include MIPS, ACO, national specialty databases (e.g., ACC, ASCO, ACS NSQIP), and others.
-
- Patient Experience/Satisfaction. Metric options include provider-specific CG-CAHPS questions (such as “rate the provider from 0-10” and “likelihood to recommend this provider”) and others.
-
- Patient Safety. Metric options include Surgical Site Infection rates and others.
-
- Operational Efficiency/Financial Sustainability. Metric options include patient access (CG-CAHPS, time to 3rd next available appointment v. benchmarks), cost per case, budget performance, and others.
-
- Citizenry. Metric options include chart completion, meeting attendance, and others.
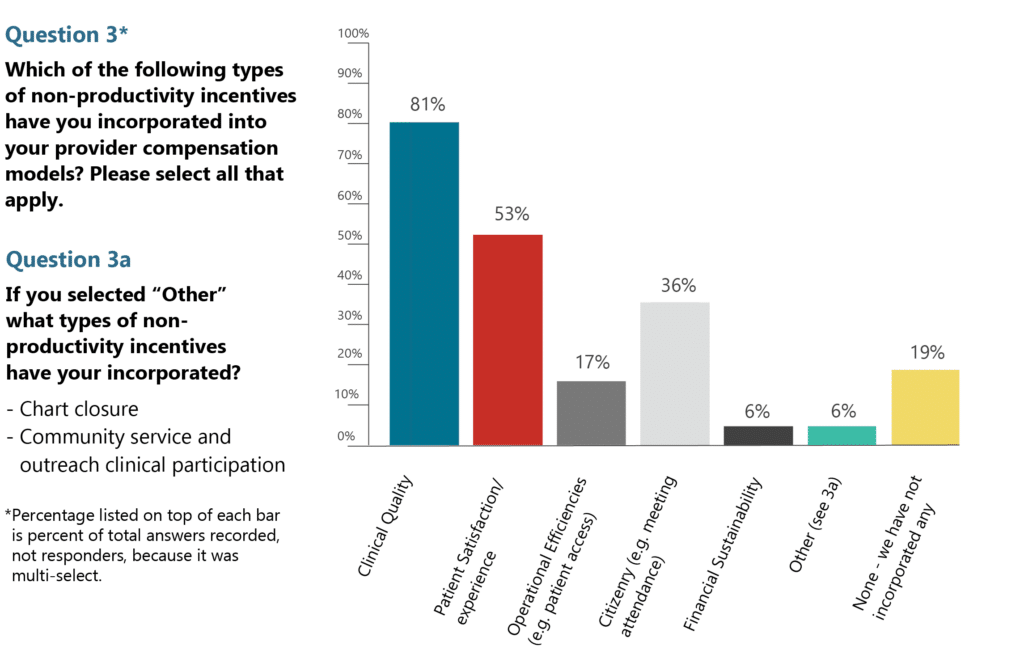
An HSG 2023 Provider Compensation Survey conducted in January/February 2023 produced the results noted in Figure 1.
Figure 1: This reflects the third question and answer reported from HSG’s 2023 Provider Compensation Survey. Full results can be found here.
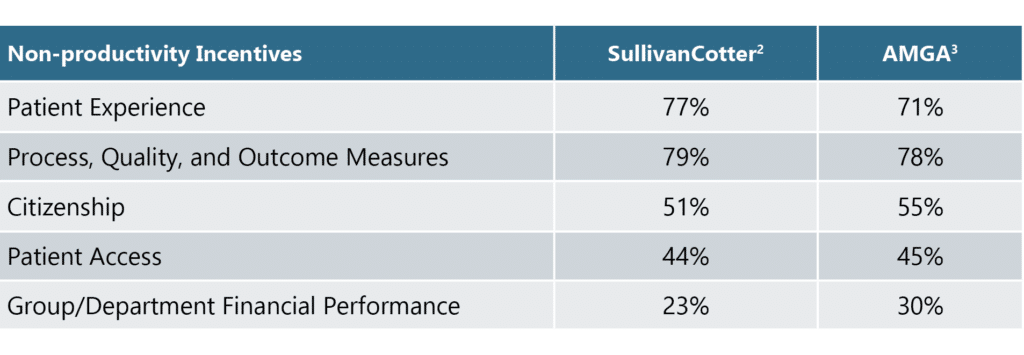
The results of national SullivanCotter and AMGA surveys were slightly different but reflect a similar array, as noted in Table 1 below.
Table 1: Results from two national compensation and productivity surveys reported in 2022, highlighting which nonproductivity incentives to consider in a compensation model.
3. What is the best way to initiate nonproductivity incentives in a provider compensation model?
When first introducing nonproductivity incentives into a provider compensation model, it is best to start conservatively with just a few metrics and simple target and payment parameters.
When selecting the metrics to include, consider the following:
-
- Only consider metrics that providers can influence and work to improve. Note that we said “influence,” not control. Being able to “control” the metric is not the standard. There is very little the providers will have total control over, but the metric selected should be within the provider’s sphere of influence.
-
- Start with only two to three metrics at the beginning. These can be expanded in the future as the providers and the system become more familiar with the process and develop enhanced support capabilities.
-
- Select metrics that are aligned with organizational goals and objectives. Emphasize metrics associated with current or planned performance improvement initiatives.
-
- Ensure that the metrics represent an opportunity to improve the current state to a desired future state.
-
- Verify data integrity exists for the selected metrics.
-
- Ensure that the employed network/ health system has the management infrastructure capabilities necessary to reliably support metric data collection, reporting, and improvement efforts.
When selecting target and payment parameters, consider the following:
-
- Start simply; select a single target to achieve (all or nothing) rather than a tiered or sliding scale approach to target achievement.
-
- Consider a fixed amount per metric that is not linked to productivity.
-
- Linking nonproductivity incentives to individual or group productivity (e.g., a portion of earned wRVUs) triples down on the productivity emphasis (base expectations, productivity incentives, nonproductivity incentives). This negates the “importance” of the nonproductivity emphasis and additionally promotes the importance of productivity.
-
- This philosophy may require a separate funding pool.
-
- Ensure that the selected targets represent a challenge to achieve so that they are not a “slam dunk” guarantee to accomplish. In these instances, valuators (and regulators for that matter) are likely to view such compensation as “guaranteed” or base compensation…this could result in unwanted compliance concerns.
When determining how much compensation to link with the nonproductivity incentives, start small so little is at risk, but large enough to garner attention and effort. The amount dedicated to nonproductivity incentives over time can and should increase – with a subsequent offsetting decrease in the productivity incentive amounts (rates). The HSG 2023 Provider Compensation Survey indicated the percentages of total compensation noted in Figure 2.
Figure 2: This reflects the fourth question and answer reported from HSG’s 2023 Provider Compensation Survey. Full results can be found on the HSG website here.
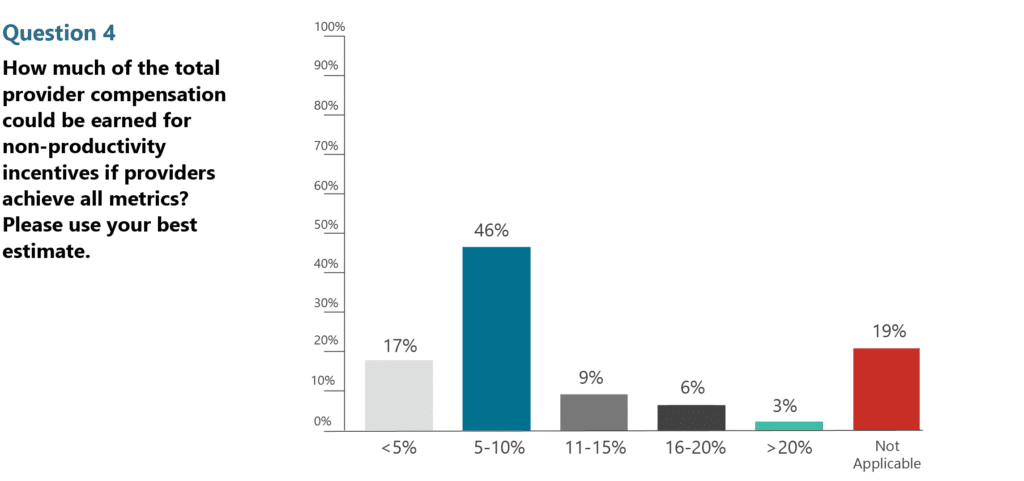
The national SullivanCotter survey4 respondents indicated that primary care, medical specialty, surgical specialty, and hospital-based provider nonproductivity incentive amounts were between 7 and 9% of total compensation.
4. How often should nonproductivity incentives be reviewed?
Nonproductivity incentive metrics and targets should be reviewed and revised at least annually to ensure that they continue to be aligned with organizational goals and objectives, represent an opportunity for improvement, and include a stretch goal to achieve. During the annual review process, consider granting credit for achieving large, rapid improvements gained during the previous year by maintaining the metric and associated target for the coming year. However, this should only apply to the initial year after the significant achievement. Continued maintenance of the gain should be expected and not rewarded thereafter.
Regular (e.g., monthly), trended reports indicating performance against the metrics and targets should be distributed to and discussed with individual providers to keep them informed of their progress (or lack thereof) and keep the incentives front of mind. Comparing individual performance against individual or aggregated peers – even in a blinded manner – tends to enhance individual and group efforts and accomplishments. Consider including the selected metrics in a regularly reported dashboard with other important metrics that are widely shared across the network.
Incorporating and subsequently expanding nonproductivity incentives in the provider compensation model(s) can shift efforts toward important organizational initiatives beyond volume and productivity – and yield sustainable outcomes, especially when associated with organizational performance improvement initiatives.
References
1. SullivanCotter 2022 Physician Compensation and Productivity Survey, Pay Practices Manager, Client Portal.
2. SullivanCotter 2022 Physician Compensation and Productivity Survey, Pay Practices Manager, Client Portal Table 3.5 Measures Used in Incentive Plans.
3. AMGA 2022 Medical Group Compensation and Productivity Survey – 2022 Report Based on 2021 Data, Page 19 Prevalence of Other Incentives and Discretionary Compensation, Table: Non-productivity Incentive and Discretionary Compensation.
4. SullivanCotter 2022 Physician Compensation and Productivity Survey, Pay Practices Manager, Client Portal Table 3.2 Mean Percentage of TCC if Used.