Connect your Data to See the Whole Story
Overview
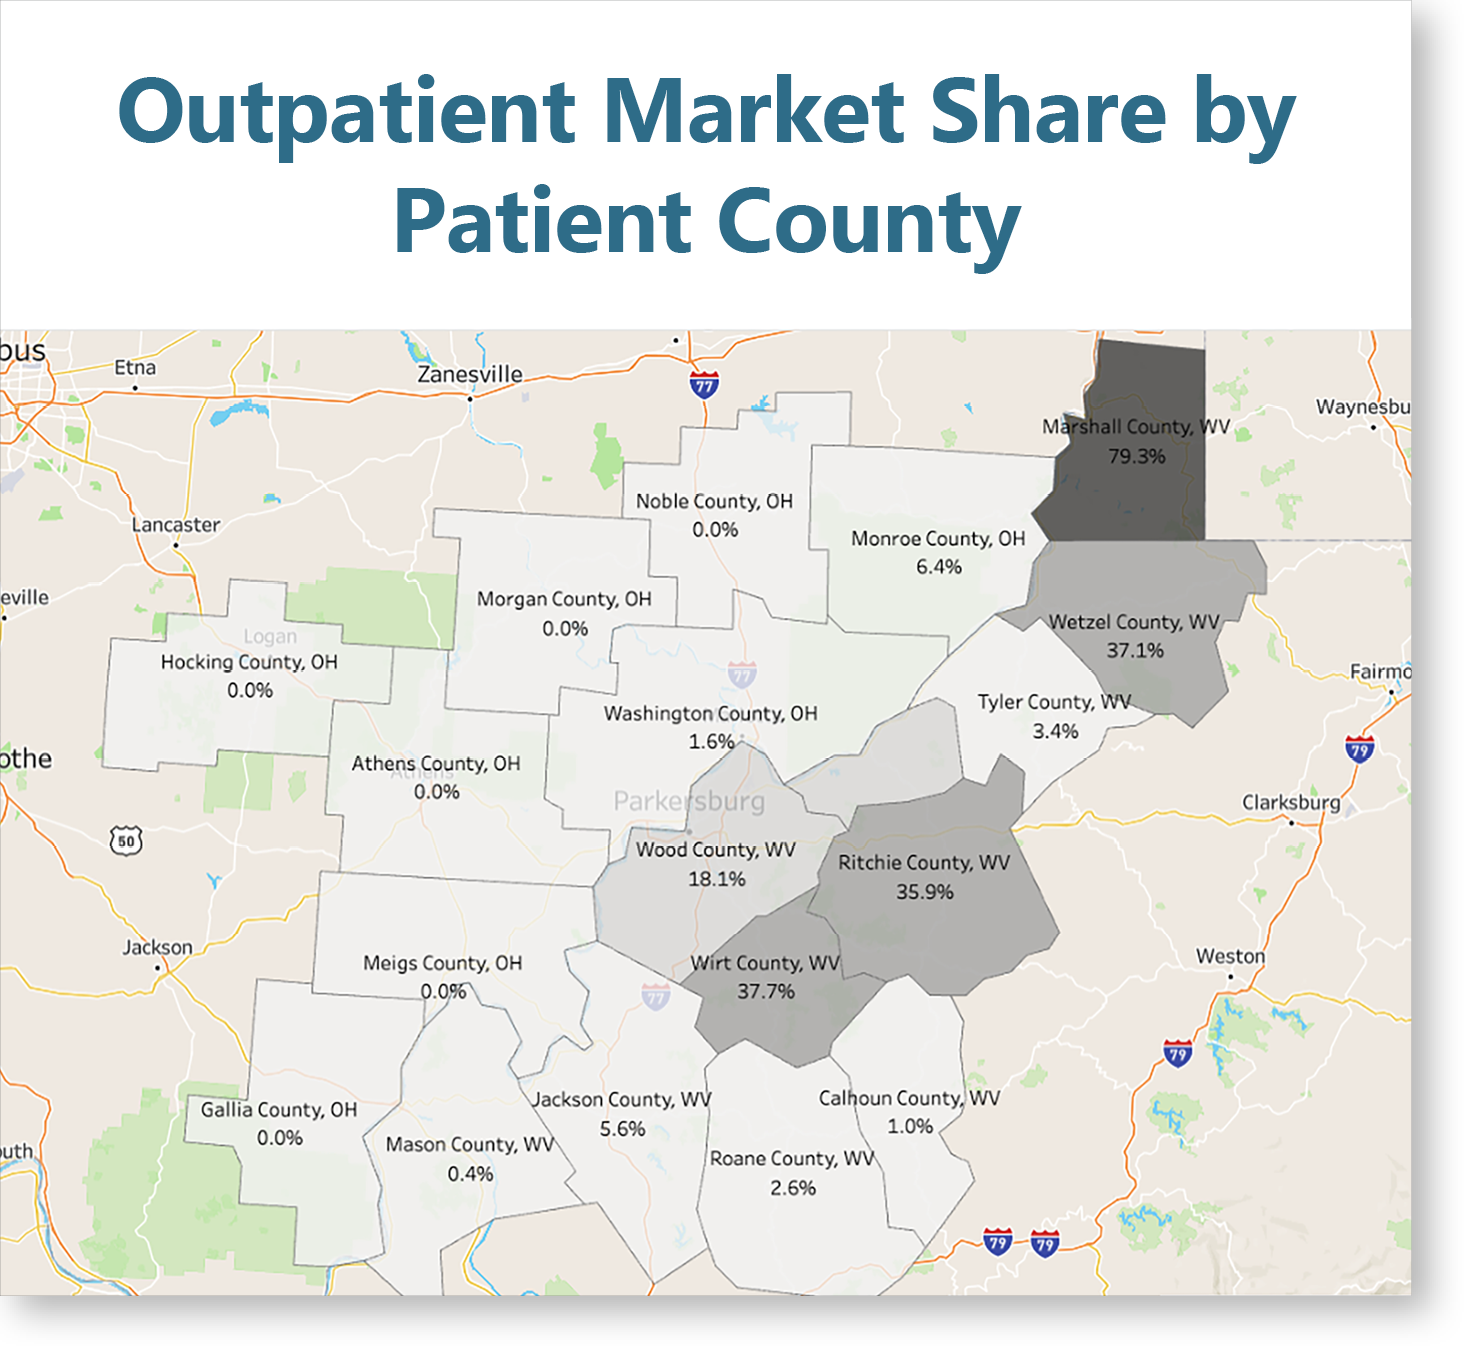
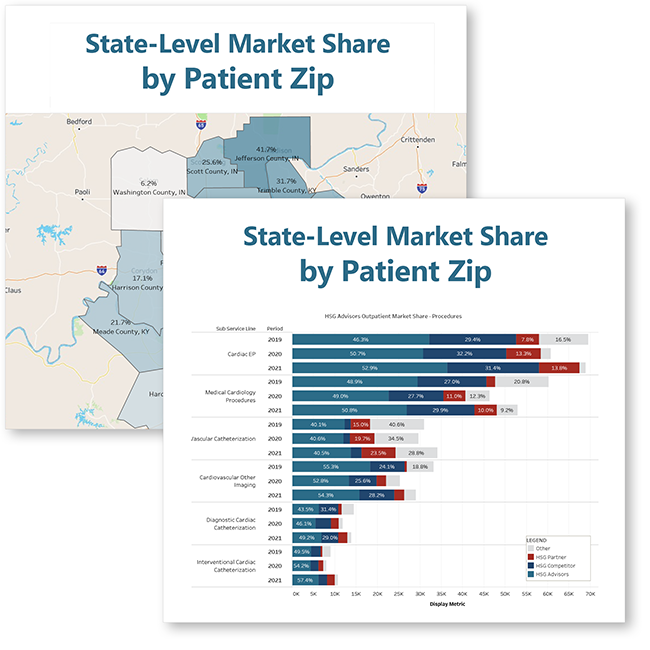
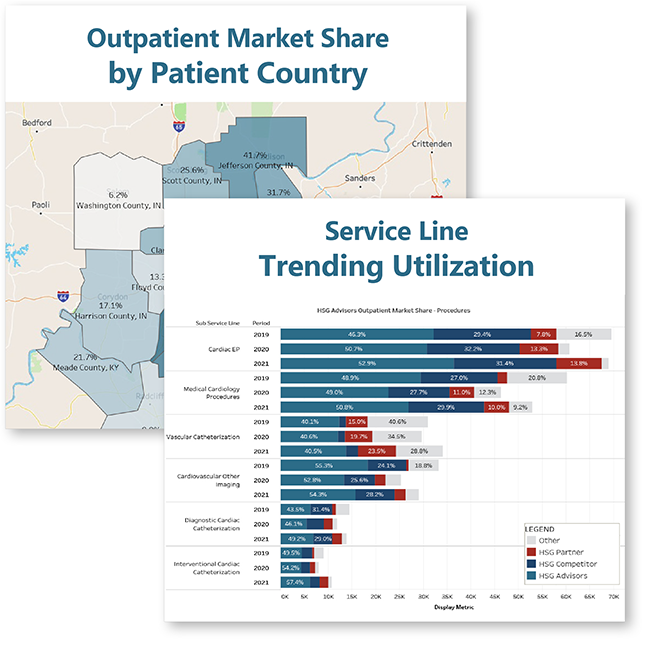
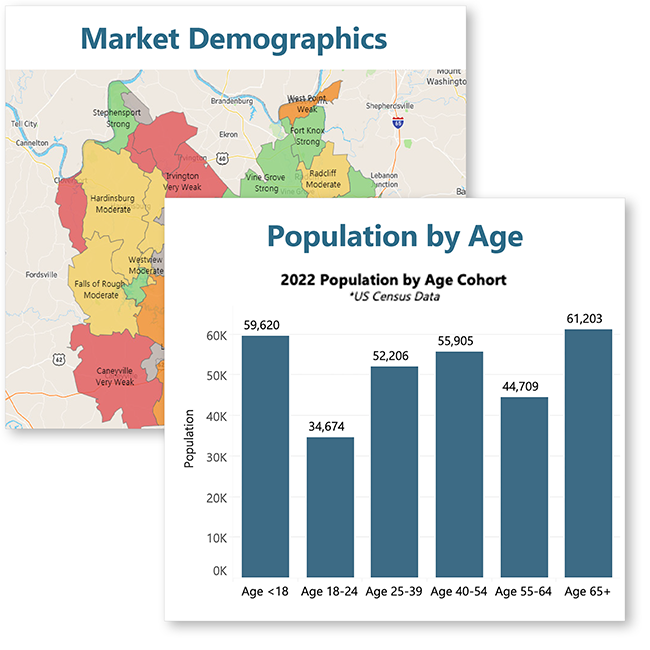
Create easy-to-understand visual overviews of state-level inpatient, outpatient, and emergency market share data, tailored to your specific market definitions.
Customizable to Your Health System’s Needs in HSG Dashboard
Workbook Features
Bring your data to life through different reporting lenses in HSG Dashboard.
- Overall Inpatient & Outpatient Market Share (based on number of Inpatient Discharges)
- Baseline reporting can be dated back to prior years and/or the historic timeline requested
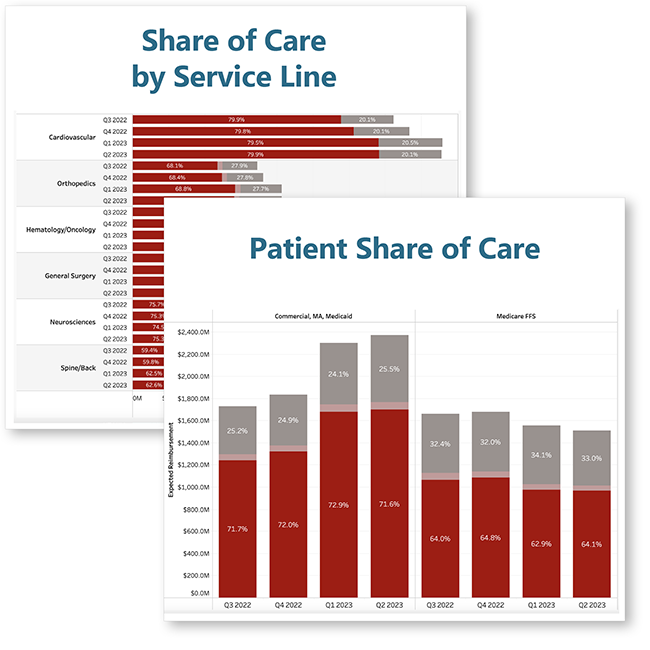
- Overall Share and Trending for all Service Lines
- Service Line Inpatient & Outpatient Share
- Reporting breakdowns could include:
- Overall Share by Service Line, Sub Service Line, and DRG (as available)
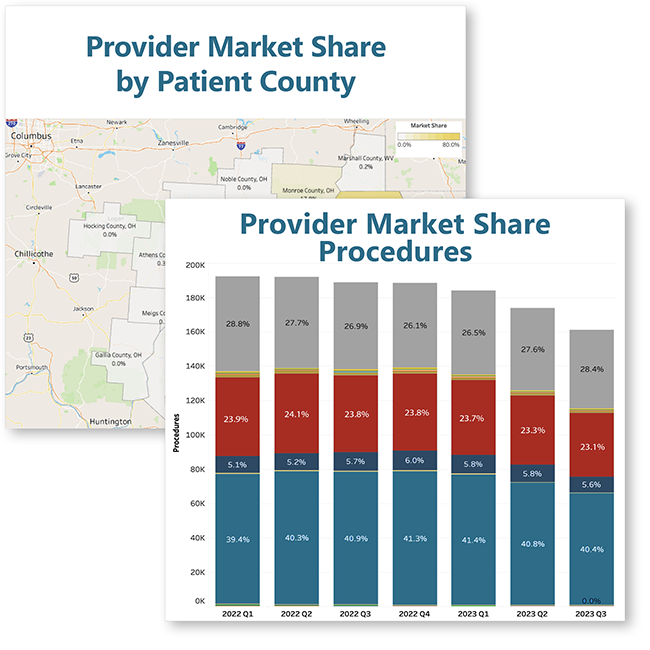
- Service Line Dashboard with Share
- by County and Zip Code (as available)
- Top 10 Service Line Location/Billing
- Entity Breakdown
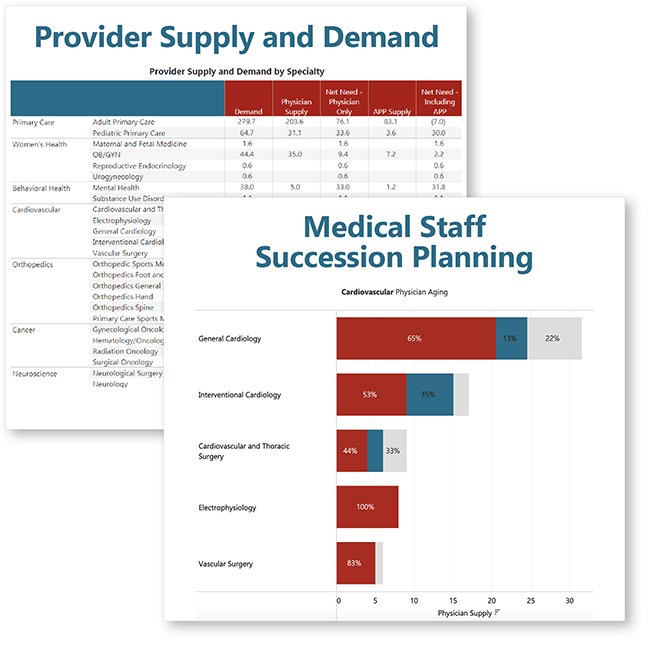
- Overall Sub Service Line Inpatient Share
- Sub Service Line Dashboard with Inpatient Share by County and by Service Area Definitions for System/Facility
- Top 10 Sub Service Line Location/Billing Entity
- Reporting breakdowns could include:
CUSTOMIZABLE TO YOUR HEALTH SYSTEM’S NEEDS
HSG Dashboard Workbooks
Related Resources
-
Understanding the Difference Between Data Governance and Analytics
Balancing data for smarter business decisions.
-
Understanding Your Competitive Market Share
Tools for Measuring Patient Acquisition and Market Competition
-
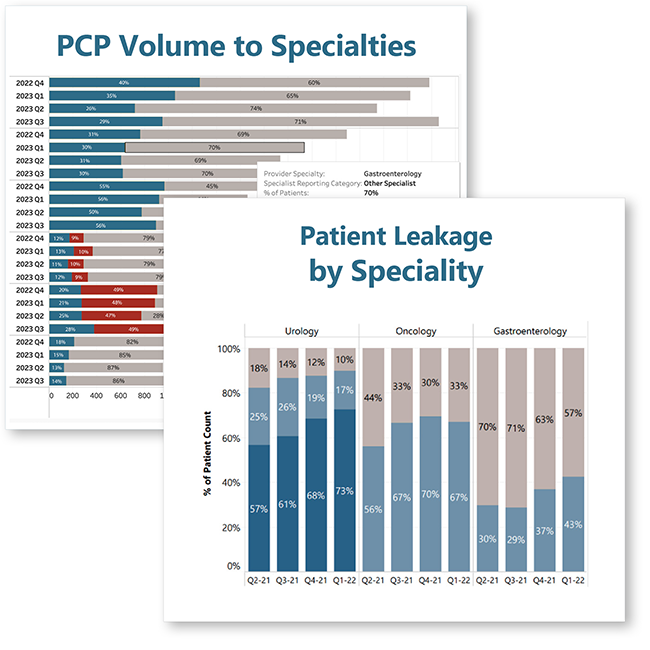
Understanding Your Primary Care Market Share
Optimize Primary Care for Growth and Patient Retention