

Case Study | Download a PDF Version of the Case Study |
Overview of Patient Volume Data
A Regional Health System centered in a rural area faced pockets of regional competition and additional tertiary competition within a 30-to-60-minute geographic radius. It had already seen outpatient services and patient utilization of health care drop significantly due to the pandemic, and its leadership team did not have adequate outpatient claims data analytics or information on the drivers of change in patient volume.
“Outpatient service volumes are critically impacting health system revenue. Physician market share needs to be clearly understood to impact the ambulatory environment.”
The Challenges
The Regional Health System needed to better understand its current patient volume and opportunities to grow market share and serve a larger number of patients within their strategic service area. The healthcare industry’s shift from inpatient to outpatient services is significant and expected to continue to affect hospital revenue for years to come. While most hospitals have ample inpatient data, they have extremely limited outpatient data. With HSG Outpatient and Physician Office Market Share the Regional Health System gained outpatient data insight in two key areas:
1. Sources of patient volumes by patient county of residence. With this insight, the hospital had a baseline for ongoing metrics and operational decisions.
2. Details on the eligible population’s outpatient healthcare utilization. The data included the percentage of usage within the organization and the percentage controlled by competitors. With HSG Advisors’ guidance, the leadership team could now identify and create a strategy to seize market opportunities.
The Data
With HSG Outpatient and Physician Office Market Share, clients have rich market data at their fingertips:
- Total volumes based on service line, sub service line, and cross service line definitions (i.e., X-ray, MRI, CT, etc.)
- A provider-level digital intelligence dashboard with physician-level market share
- “Percentage of total” outpatient utilization metrics by unique patient service volumes and total procedural volumes
- A list of all the specialists that are providing office-based visits to a patient that lives in specified areas
- Provider detail with granular information (e.g., primary care), specialist level, or sub-specialist level by provider service type
The Process
HSG Advisors provided comprehensive data, analysis of the data, and strategic guidance to the hospital on effectively utilizing the data. During the hospital’s engagement, it was discovered that a large independent primary care provider group was actually steering volume around the hospital’s specialists, curtailing the flow of patient services. Since patient volume is provider-relationship driven, the team decided to acquire and employ the primary care group. By bringing the group under the same umbrella, those relationships began to build and become a source of higher inpatient and outpatient service volumes.
KEY FINDINGS
We drilled down to identify the market share each individual provider has in the area, how many patients in the area are actually utilizing services, and the total volume of imaging services by provider.
The Results
With ongoing metrics, the health system’s leadership team could track ROI, measure the quantifiable value of employing the primary care provider group, and benefit from increases in overall patient service volume. Specifically, the organization gained:
1. A greater than 1% increase in unique patient volumes and capture volumes for the following key outpatient service lines associated with primary care patients.
– Labs
– Office-Based Visits
– Radiology
– Orthopedics
– Emergency Visits
– Oncology
– Urology
– Gyn and OB

2. More specifically, outpatient orthopedic market share growth was across all sub-service line definitions except for MRI. The outpatient joint replacement volume grew by 22% across the market area and the clients capture of the market increased by 4% from 2019 to 2021.

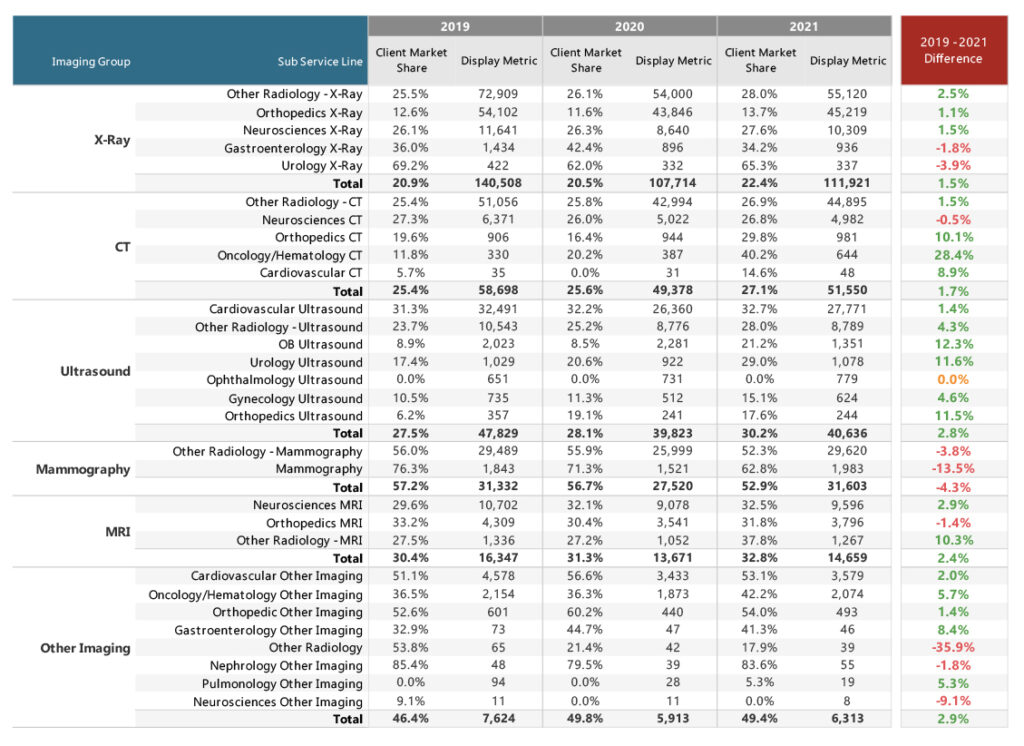
3. Imaging leakage was identified as low-hanging fruit for organizational growth. The client was able to increase market share by >1% across all imaging groups.
4. Strategic insight into primary care groups in the market were a primary driver of overall growth – the hospital thought there were multiple independent primary care groups that were competitive in terms of market share in the service area, HSG Advisors identified that one was far outpacing the other, and the hospital aligned with the higher-growth group to drive growth overall outpatient growth.
Consulting
In addition to identifying growth opportunities, HSG Advisors provided nine months of on-site interim management to facilitate the integration of the primary care provider group—including ongoing data analysis, guidance on provider placement, consulting on the impact on core services, and practice optimization. Integration of large independent practices can be very taxing on organizations already limited with personnel. HSG Advisors was able to provide day-to-day management to ensure practice integration was optimal.