|
Download a PDF of this article to share with your team |
“What dollar rates per wRVU should we be using for our employed provider wRVU compensation models?”

It is, therefore, immensely important to ensure you are using rates that are 1) market competitive for each provider’s specialty; 2) sustainable for the organization; and 3) within fair market value and commercial reasonableness parameters. This article details our approach to finding the right balance between these sometimes competing, but equally important priorities.
Our Approach
We help clients determine appropriate rates by evaluating three factors:
- Relevant survey data (i.e., national vs. regional, hospital vs. physician-owned, academic vs. non-academic)
- Organization-specific factors (i.e., relative level of cost to operate a practice)
- Local market knowledge (i.e., payer mix and payer rates)
Fortunately, there exists ample survey data detailing compensation and wRVUs for almost all specialties and sub-specialties. It is important to select a survey source or sources that are appropriately matched to organization, market, specialty, and practice type (i.e., academic vs. non-academic). With a thorough understanding of the make-up of survey respondents, we work with clients to select a survey source (or sources) where it is reasonable to conclude that the majority of respondents are most similar to our client provider or providers in question. Most often, this involves blending multiple surveys—consistent with Stark Phase III commentary, in which CMS offered the following guidance for determining fair market value: “Reference to multiple, objective, independently published salary surveys remains a prudent practice for evaluating fair market value.”
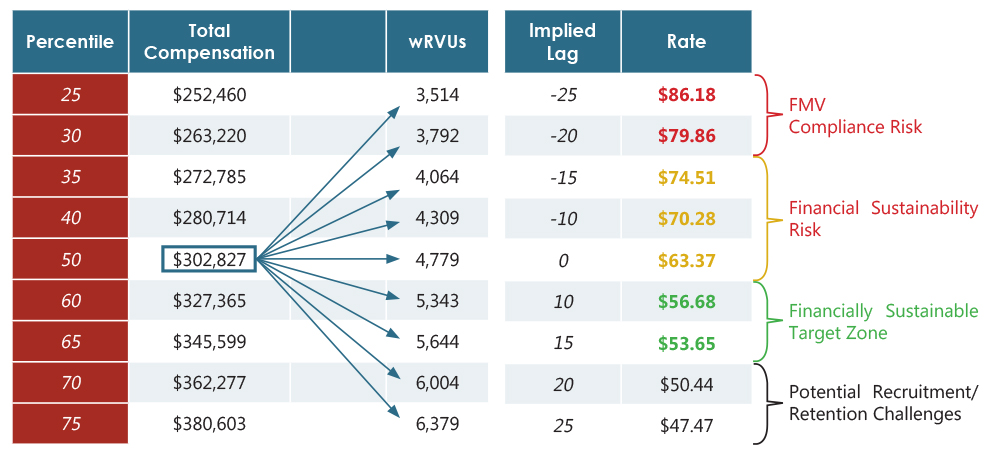
Once the proper survey sources have been determined, we use the survey data to understand how compensation is related to wRVUs at varying percentiles, realizing that in reality, production does not typically match with compensation percentile-to-percentile. In actuality, economics and market factors dictate that physicians earn compensation at varied rates per wRVU produced. In the example below, we are using Medical Group Management Association (MGMA) National data to calculate potential rates for neurology. We start by observing the median level of total compensation. We then divide this median compensation by differing levels of wRVU production. In our example, a neurologist who earns at the median and produces at the median would have an imputed rate of $63 per wRVU. In other words, this rate would allow for parity between compensation and production percentiles, again not the norm in many, if not most markets. A rate of $57 would require the physician to produce 65th percentile wRVUs in order to earn at the median. A rate of $75 would allow the physician to earn median compensation while producing 35th percentile wRVUs. When this process is repeated for a variety of compensation and wRVU combinations, a range of rates is formed as pictured in the following example:
Rate Calculation – Neurology
Detailed Rate Range Calculation – Using 2018 MGMA: National

Rates at the bottom of this range may hinder an organization’s ability to recruit and retain high-quality providers as the gap between production and compensation may be too much (i.e., median compensation for 70th to 75th percentile production). On the other hand, rates from the center to the high end of the scale are financially unstainable and may create compliance risks. The correct or optimum rate for an organization is, unsurprisingly, somewhere towards the middle— the lower end of middle, to be more precise ($56.68 to $53.65 in our example). Exactly where in that tight little range, however, is a dependent on a variety of organization-specific factors. These factors include, but are not limited to the following:
Market Demographics and Payer Mix
Organizations who operate within demographically favorable markets are likely to enjoy a payer mix that skews toward commercial reimbursement. With lower proportions of Medicare and Medicaid, these organizations may collect more dollars per wRVU. This, in turn, allows for financial sustainability even with higher physician costs per wRVU.
Payer Rates
It is important to note, however, that commercial revenue is dependent on the payer-specific rates and contracts. An organization with ample commercial volume, but below-average commercial rates (i.e., 100% of Medicare or less) may not have enough total revenue per wRVU to justify higher physician compensation rates – similar to one with a poor payer mix. A thorough analysis should be conducted to determine how payer rates and total revenue per wRVU compares to expected benchmarks.
Revenue Cycle Effectiveness
In both of the above categories, total revenue per wRVU is a driving factor in determining a financially sustainable range for physician compensation. A great payer mix and superb payer rates will not do you and your organization any good if your revenue cycle team needs a gun and a ski-mask to collect a dime. The effectiveness and efficiency of the revenue cycle function is imperative to avoiding, or at least managing losses.
Provider Benefits
The survey data used to calculate the example range above is based entirely on cash compensation (W-2 compensation) and does not take into account fringe benefits (i.e., health insurance, retirement plan, payroll taxes, etc.) offered by the organization. If the value of an organization’s benefit package is above average, this may leave fewer dollars available for cash compensation. In this situation, a market-average rate per wRVU may not be financially sustainable to the organization. Tip: Do not undervalue or totally omit the value of your organization’s benefits. Be up-front regarding your benefit structure and value in your discussions with physicians, particularly physicians you are acquiring from independent practice, as many do not have the robust benefit structure that a health system or hospital offers. Often organizations make the mistake of focusing solely on the value of salary and bonuses and not the benefits which have real value too. Show physicians the dollar value of the benefits you are providing, don’t let them lose sight of this important piece of the total package.
Other Practice Costs
A proper analysis must determine how other practice expenses compare to relevant benchmarks. If other expenses (such as practice staffing, building expense, or administration expense) are higher than expected, this will put downward pressure on physician rates per wRVU.
Range of Services
Your practice may not provide the same mix of professional and/or ancillary services “within the walls” of the practice as is typical within a given specialty. If this is true, the level of revenue that can be generated by the practice is affected in a downward manner. This too must be evaluated and considered when searching for the right compensation rate per wRVU. At the very least, this must be acknowledged and expected. Physicians shouldn’t suffer and provider groups’ ability to recruit shouldn’t be hampered by a health system decision to do ancillary testing or procedures in the hospital.
In addition to the above factors, an organization must incorporate local market knowledge into the process of determining rates. Recruiters and providers may often have insight into rates and offers made by other organizations in the market or region. These insights are more specific than national survey data and should be considered when determining an appropriate physician compensation rate structure. We often see clients forced into rates and compensation offers that require them to push the limits of what they want to do, but they feel they have to or risk losing valued physicians, or risk not being able to hire new physicians.
Are You Pursuing wRVU Compensation Models That Are Financially Sustainable and FMV Compliant?
HSG partners with employed physician networks across the country to implement this type of analysis and move towards sustainable subsidies through performance improvement plans while offering Fair Market Value Opinions. For more information, contact Eric Andreoli or Neal Barker.
