
HSG Advisors & AAPCP Article | Download a PDF Version of the Article |
Written By: Neal D. Barker, HSG Partner
Fair market value determination for physician and advanced practice provider (“APP”) compensation, or healthcare provider compensation, has always been filled with a measure of uncertainty. Without a universally accepted or standardized process, formula, or report for the healthcare industry to reference, the conclusion of a fair market value process often leaves an organization’s leadership wondering if they have done enough.
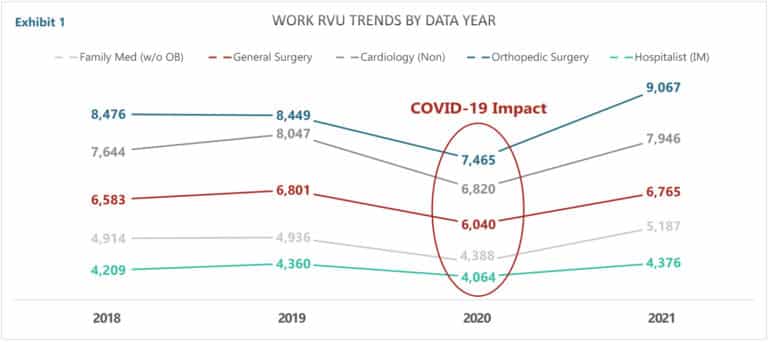
Two major events in the past two years (the COVID-19 pandemic and the 2021 Medicare Physician Fee Schedule changes) have added to healthcare organizations’ fair market value uncertainty. The COVID-19 pandemic had a significant downward impact on provider production in 2020, which was reflected in 2021 healthcare provider compensation and production surveys. The 2021 surveys’ production data reflects the days and weeks during the height of the pandemic in which outpatient practices paused in-office operations and hospitals canceled and delayed surgeries and procedures.
This depression of patient volume can be seen in the Medical Group Management Association (“MGMA”) Work Relative Value Unit (“wRVU”) data for five selected specialties; family medicine w/o OB, general surgery, cardiology non-invasive, orthopedic surgery, and internal medicine hospitalists are presented in the chart below (Exhibit 1). Exhibit 1 displays median wRVUs for 2018, 2019, 2020, and 2021, as reported by MGMA’s Physician Compensation and Productivity Surveys.,
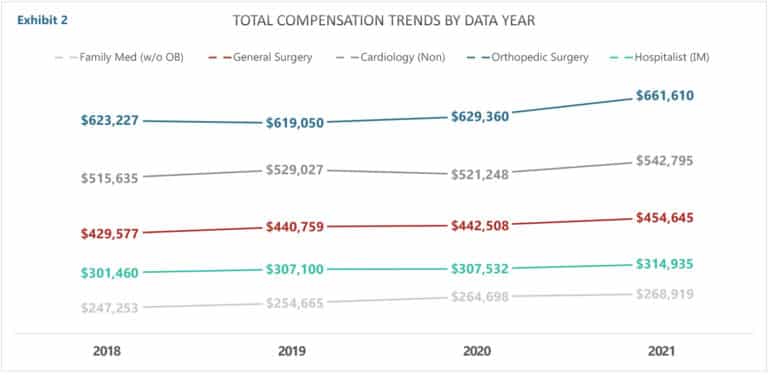
During this challenging time, many hospitals and health systems that employ physicians and APPs suspended salary reductions due to below-target production, and many others paid bonuses based on pre-pandemic production rates. As such, the trend with healthcare provider compensation was relatively flat, as can be seen in Exhibit 2 below. Exhibit 2 presents the median MGMA compensation (2018-2021) for family medicine w/o OB, general surgery, cardiology non-invasive, orthopedic surgery, and internal medicine hospitalists.
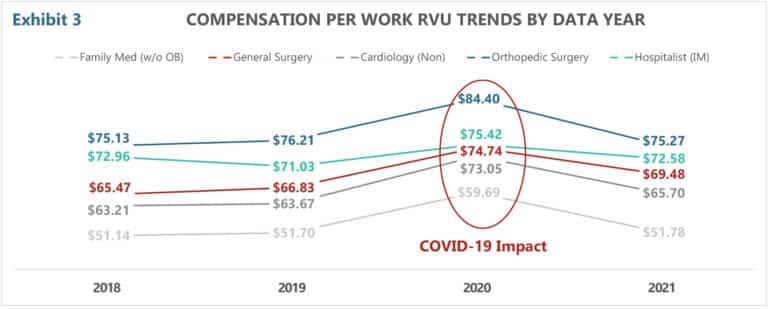
When a flat and relatively unchanged trend in compensation is divided by depressed wRVU volume, the result is an increased compensation per wRVU ratio—more specifically, an artificially increased compensation per wRVU ratio. This result is demonstrated in Exhibit 3 below. Clearly, the increase in the compensation per wRVU ratio is not indicative of an increase in the value of professional services but is a reflection of depressed production. Blind utilization of this data is extremely problematic. Misinterpretation of this data for fair market value determination will lead to incorrect conclusions. Worse yet, blindly using this data in contracting with physicians and APPs will lead to compensation that is outside the reality of fair market value and is not financially sustainable. Unfortunately, we’ve seen a number of organizations use this data to set and/or evaluate provider compensation—often with expensive and unsustainable consequences.
If the impact of COVID wasn’t enough to throw compensation fair market value evaluation into a state of flux and uncertainty, healthcare providers also had to deal with updates to the Medicare Physician Fee Schedule (“MPFS”) . The Centers for Medicare and Medicaid Service’s (“CMS’s”) 2021 MPFS changes (specifically the increase to E/M codes’ wRVU values) drastically increased wRVU production overnight for many providers across a variety of specialties.
The convergence of these environmental factors, coupled with the manner and degree to which organizations have responded to the pandemic and CMS’s MPFS changes, creates a significant challenge for FMV determination today. Because CMS’s MPFS changes brought increases in wRVUs, but not proportional increases in revenue (see the 3.4% decrease in the 2021 MPFS conversion factor), many organizations have responded (or are in the process of responding) with changes to their wRVU-based compensation models. Other organizations have yet to move to away from the 2020 MPFS’s wRVU values for provider production and compensation calculation.
Exhibit 1 clearly illustrates the return of volume from COVID. You can also infer that wRVUs are higher due to the impact of the MPFS changes. That said, we believe the full impact of the MPFS changes is not completely represented in the benchmark data. It is probable that the wRVU levels for most specialties will continue to rise over the next couple years, particularly primary care and medical specialties, those specialties in which E/M codes make up the majority of their overall CPT volume. Currently, many organizations across the country have yet to adopt the new wRVU values. Therefore, given the reality that survey providers only report out what is reported to them by survey respondents, the current surveys are an amalgamation of 2020 and 2021 MPFS wRVU values.
From HSG’s perspective, it will likely take at least a couple of years before the survey data stabilizes. (Or surveys will embrace Sullivan Cotter’s format and report total wRVUs on the 2020 schedule, as well as wRVUs on the 2021 schedule.) In the meantime, fair market value determination (especially where wRVU production is involved) will require some extra effort, creativity, and perhaps third-party opinion. No doubt, it is going to be as challenging as it ever has been.
HSG’s approach is to adjust pre-COVID wRVU data based on the estimated percentage increase in wRVU production, as forecasted using Medicare utilization data applied to 2020 wRVU values and 2021 wRVU values. Exhibit 4 presents the projected percentage increase in wRVUs for several specialties.
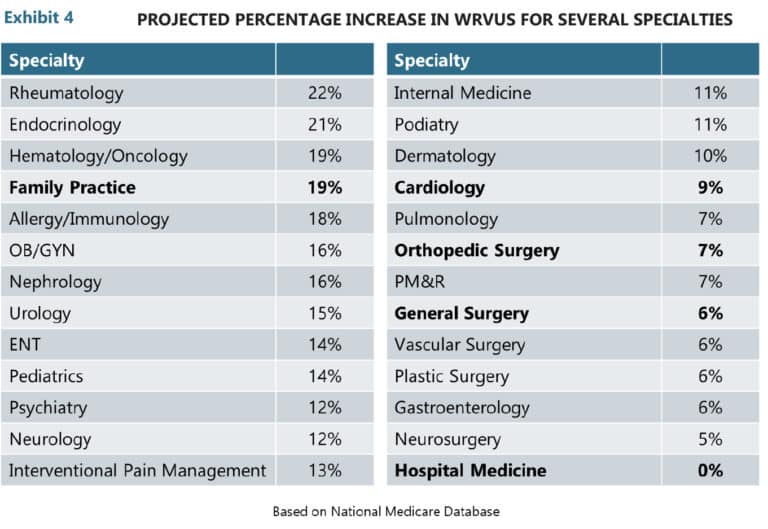
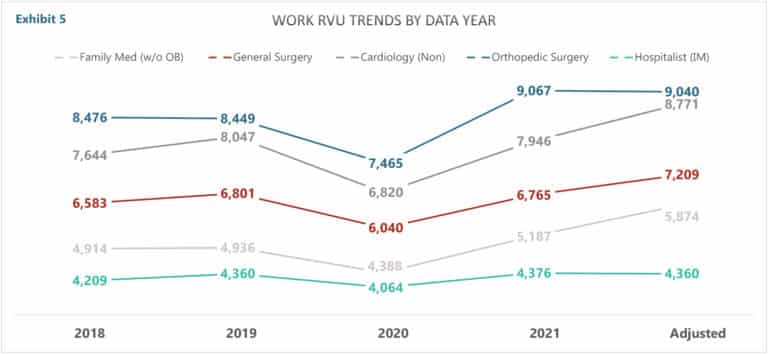
Using the percentages in Exhibit 4, applied to pre-COVID wRVU data gives a realistic estimate of where we think wRVU data will most likely end up after most organizations adopt the 2021/22 wRVU values. Exhibit 5 presents wRVU data for 2018, 2019, 2020, 2021, and Adjusted. Utilizing the Adjusted wRVU data is helpful for evaluating expected production versus projected compensation, as well as calculating appropriate compensation per wRVU ratios.
Finally, the past two years have taught us a few lessons that apply to the structure of agreements and contracts with providers. Provided below are seven lessons learned (and we’ve seen others learn the hard way) over the past two years.
1. Contractually, do not tie compensation rates (compensation per wRVU ratios) or production thresholds to annual survey data. There are inherent issues with this, but as 2020/2021 demonstrated, anything can happen in one snapshot in time (i.e., a global 100-year pandemic and the most significant changes to RBRVS in decades).
- Compensation and contracts should be informed by the survey data, but not directly linked to it (i.e., a bonus factor equal to the current benchmark survey median compensation per wRVU ratio for general surgery).
2. The wRVU values are equally important to the wRVU-based compensation calculation as the compensation per wRVU rate has traditionally been. Contractually, give your organization the flexibility to change, or stay on, wRVU tables on your schedule. Make sure you have time to assess, educate, and implement—on your schedule—not CMS’s.
3. Educate providers regarding the value of the wRVUs themselves, the tables being utilized, and their total compensation potential as much as the compensation per wRVU rate.
- Communicate challenges and philosophy as well as plans to address them.
4. Avoid blind utilization of the 2021 and 2022 survey production and compensation per wRVU data as it reflects the 2020 COVID-related downturns and partial implementation of the 2021 MPFS wRVU values.
5. If adjusting production data, don’t assume you fully understand the corresponding relationship it has with compensation given the variety of responses to the MPFS changes in the market.
- Scenario modeling may be advised/necessary.
6. Challenges present opportunities. It is a great time to bring about change and incorporate nonproduction-based incentives and rightsize models that have historically been questionable.
7. Salary surveys and ceiling percentiles are not automatic, so seek the advice of an experienced healthcare compensation valuation expert.
For more information on compensation plan development or to work with a third party to verify fair market value, contact the experts at HSG Advisors.
