How much is referral leakage costing your organization and what are you doing about it? Network referral capture and leakage rates are baseline metrics every health system should be tracking to inform strategy and tactics to build loyalty and grow revenue. A comprehensive understanding of physician referral patterns and patient capture allows organizations to answer such questions as:
How well are we managing our provider relationships?
How are referral patterns changing and where are we vulnerable?
Are we making the right physician alignment decisions?
Where do we need to focus efforts to strengthen provider loyalty?
Where are our opportunities for revenue growth?
Referral leakage occurs for many reasons, from both employed and independent providers. It can be driven by concerns about quality, patient access and communications problems, lack of awareness of providers or simply friendships. Whatever the reasons, the revenue impact can be significant, and reliable, easy-to-discern data is needed to understand where it’s occurring, the volume it represents, and how it’s trending.
Based on Merritt Hawkins 2016 Physician Inpatient/Outpatient Revenue Survey reported median downstream revenue figures for All Physicians, 100-percent revenue capture or leakage from one physician can have a $1.6 million impact on your organization. If leakage is only 10 percent, uncaptured revenue is $160,000; if leakage is 30 percent, the uncaptured revenue is $480,000. Extrapolate that over your entire physician network, and the revenue impact becomes significant.
Measuring Leakage
We have found that most organizations have limited knowledge about their network’s loyalty, typically relying upon volume by provider and anecdotal data to inform their understanding and actions. Quantitative leakage measurement is a valuable tool to have in your toolbox. Benchmarking current leakage rates, trending those rates over time, and detecting issues your team should immediately address will have a direct impact on your organization’s bottom line. We recommend measuring the following leakage rates to quickly identify the lowest hanging fruit.
1. Individual Provider to Acute Care Leakage – What is the referral capture rate for each individual provider within your network? Benchmark everyone in your network and there will be surprises in provider loyalty and leakage rates.

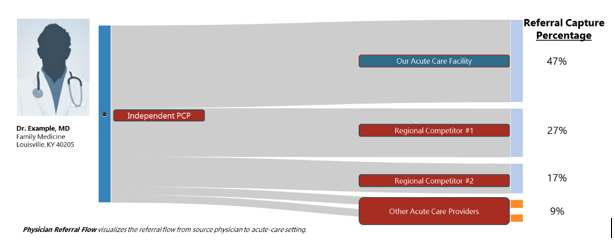
Dr. Example’s data above displays an individual provider’s total patient volume on the left-hand side and any acute care facility that the provider shares a patient with within thirty days on the right-hand side. The fifty-three percent leakage of acute care referrals is worth investigating. Presenting data in an easily digestible format allows organizations to spend less time analyzing data and more time executing on the strategic insights.
2. Physician Network to Acute Care Leakage – What is the referral capture rate for your physician network, cumulatively? Combining providers into groups and looking at their data provides immediate insight regarding leakage rates for larger groups of providers. Like Dr. Example’s individual graphic above, providers can be aggregated together on the left-hand side of the visual with hospitals on the right-hand side to calculate leakage rates for entire networks, service lines, etc.
3. Primary Care to Specialty Care Leakage – How reliant are your employed specialists on independent primary care referrals? In addition to identifying opportunities, this data allows you to evaluate potential risks should independent provider referral patterns change. Primary care provider to specialty care provider leakage rates can be presented in the same format as above, highlighting alignment opportunities. This same analysis can also focus on the retention of network primary care to network specialty care referrals.
Managing Leakage
Measuring the three leakage rates reviewed above allows you to understand where leakage is occurring throughout your network. When tracked over time, it enables you to witness shifts in referral volume, work with providers to define root causes, identify opportunities for improvement, and implement plans to address problems and build loyalty.
Provider referral patterns change, sometimes abruptly, because of issues that can often be corrected if recognized. Measurement of leakage rates and quarterly management of trends over time permits organizations to consistently identify problem areas and execute improvement plans. While some leakage isn’t controllable, we have found this number to be much smaller than most executives think.
The end goal is to create a repeatable program that is measurable, can be managed regularly, and allows you to stay focused on continual, incremental improvement and revenue growth.
For more information on measuring and managing your organization’s leakage rates, contact DJ Sullivan, Senior Consultant/Business Development Manager, at djsullivan@hsgadvisors.com to schedule a live-demo of our Physician Network Intelligence Consulting Platform.
