Healthcare leaders continue to manage service shifts to the outpatient and ambulatory environment, which makes understanding the story behind outpatient utilization data even more critical. Aggregate outpatient data is useful for recording macro trends but misleading as a tool for outlining market-driven strategic priorities. Fully understanding market dynamics and developing relevant growth strategies requires a deeper look at market-specific data.
Outpatient utilization is highly service-specific and varies greatly by geography. To review national trends in outpatient utilization more specifically, read the entire article.
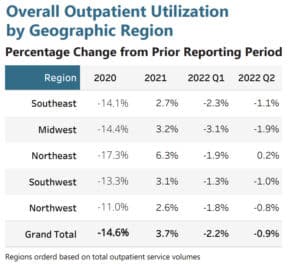
At the highest level, in the height of the global COVID-19 pandemic, HSG Advisors measured outpatient utilization dropping by 14.6% across the U.S. in 2020 (see table below). Total aggregate utilization began to rebound in 2021 and 2022, but overall numbers through 2022 still registered ~10% below 2019 volumes. These two data points, taken alone, do not reflect the complete picture of outpatient utilization during and
after the pandemic.

In this depiction, the largest volume of outpatient services is being provided to patients in the Southeast Region. The Northeast Region saw the most significant drop in outpatient utilization from 2019 to 2020 (-17.3%) but also bounced back the fastest from 2020 to 2021 with a 6.3% increase that remained relatively stable throughout 2022. Outpatient utilization in the Northwest Region has been the most stable and least variable throughout the past three years. The 11.0% drop from 2019 to 2020 was the least significant.

